Earlier this week on Monday, July 24, the world’s largest cryptocurrency Bitcoin (BTC) saw some selling pressure with the BTC price now hovering around $29,000. The Bitcoin price has broken under the support of $29,872 with the next support zone at $27,500.
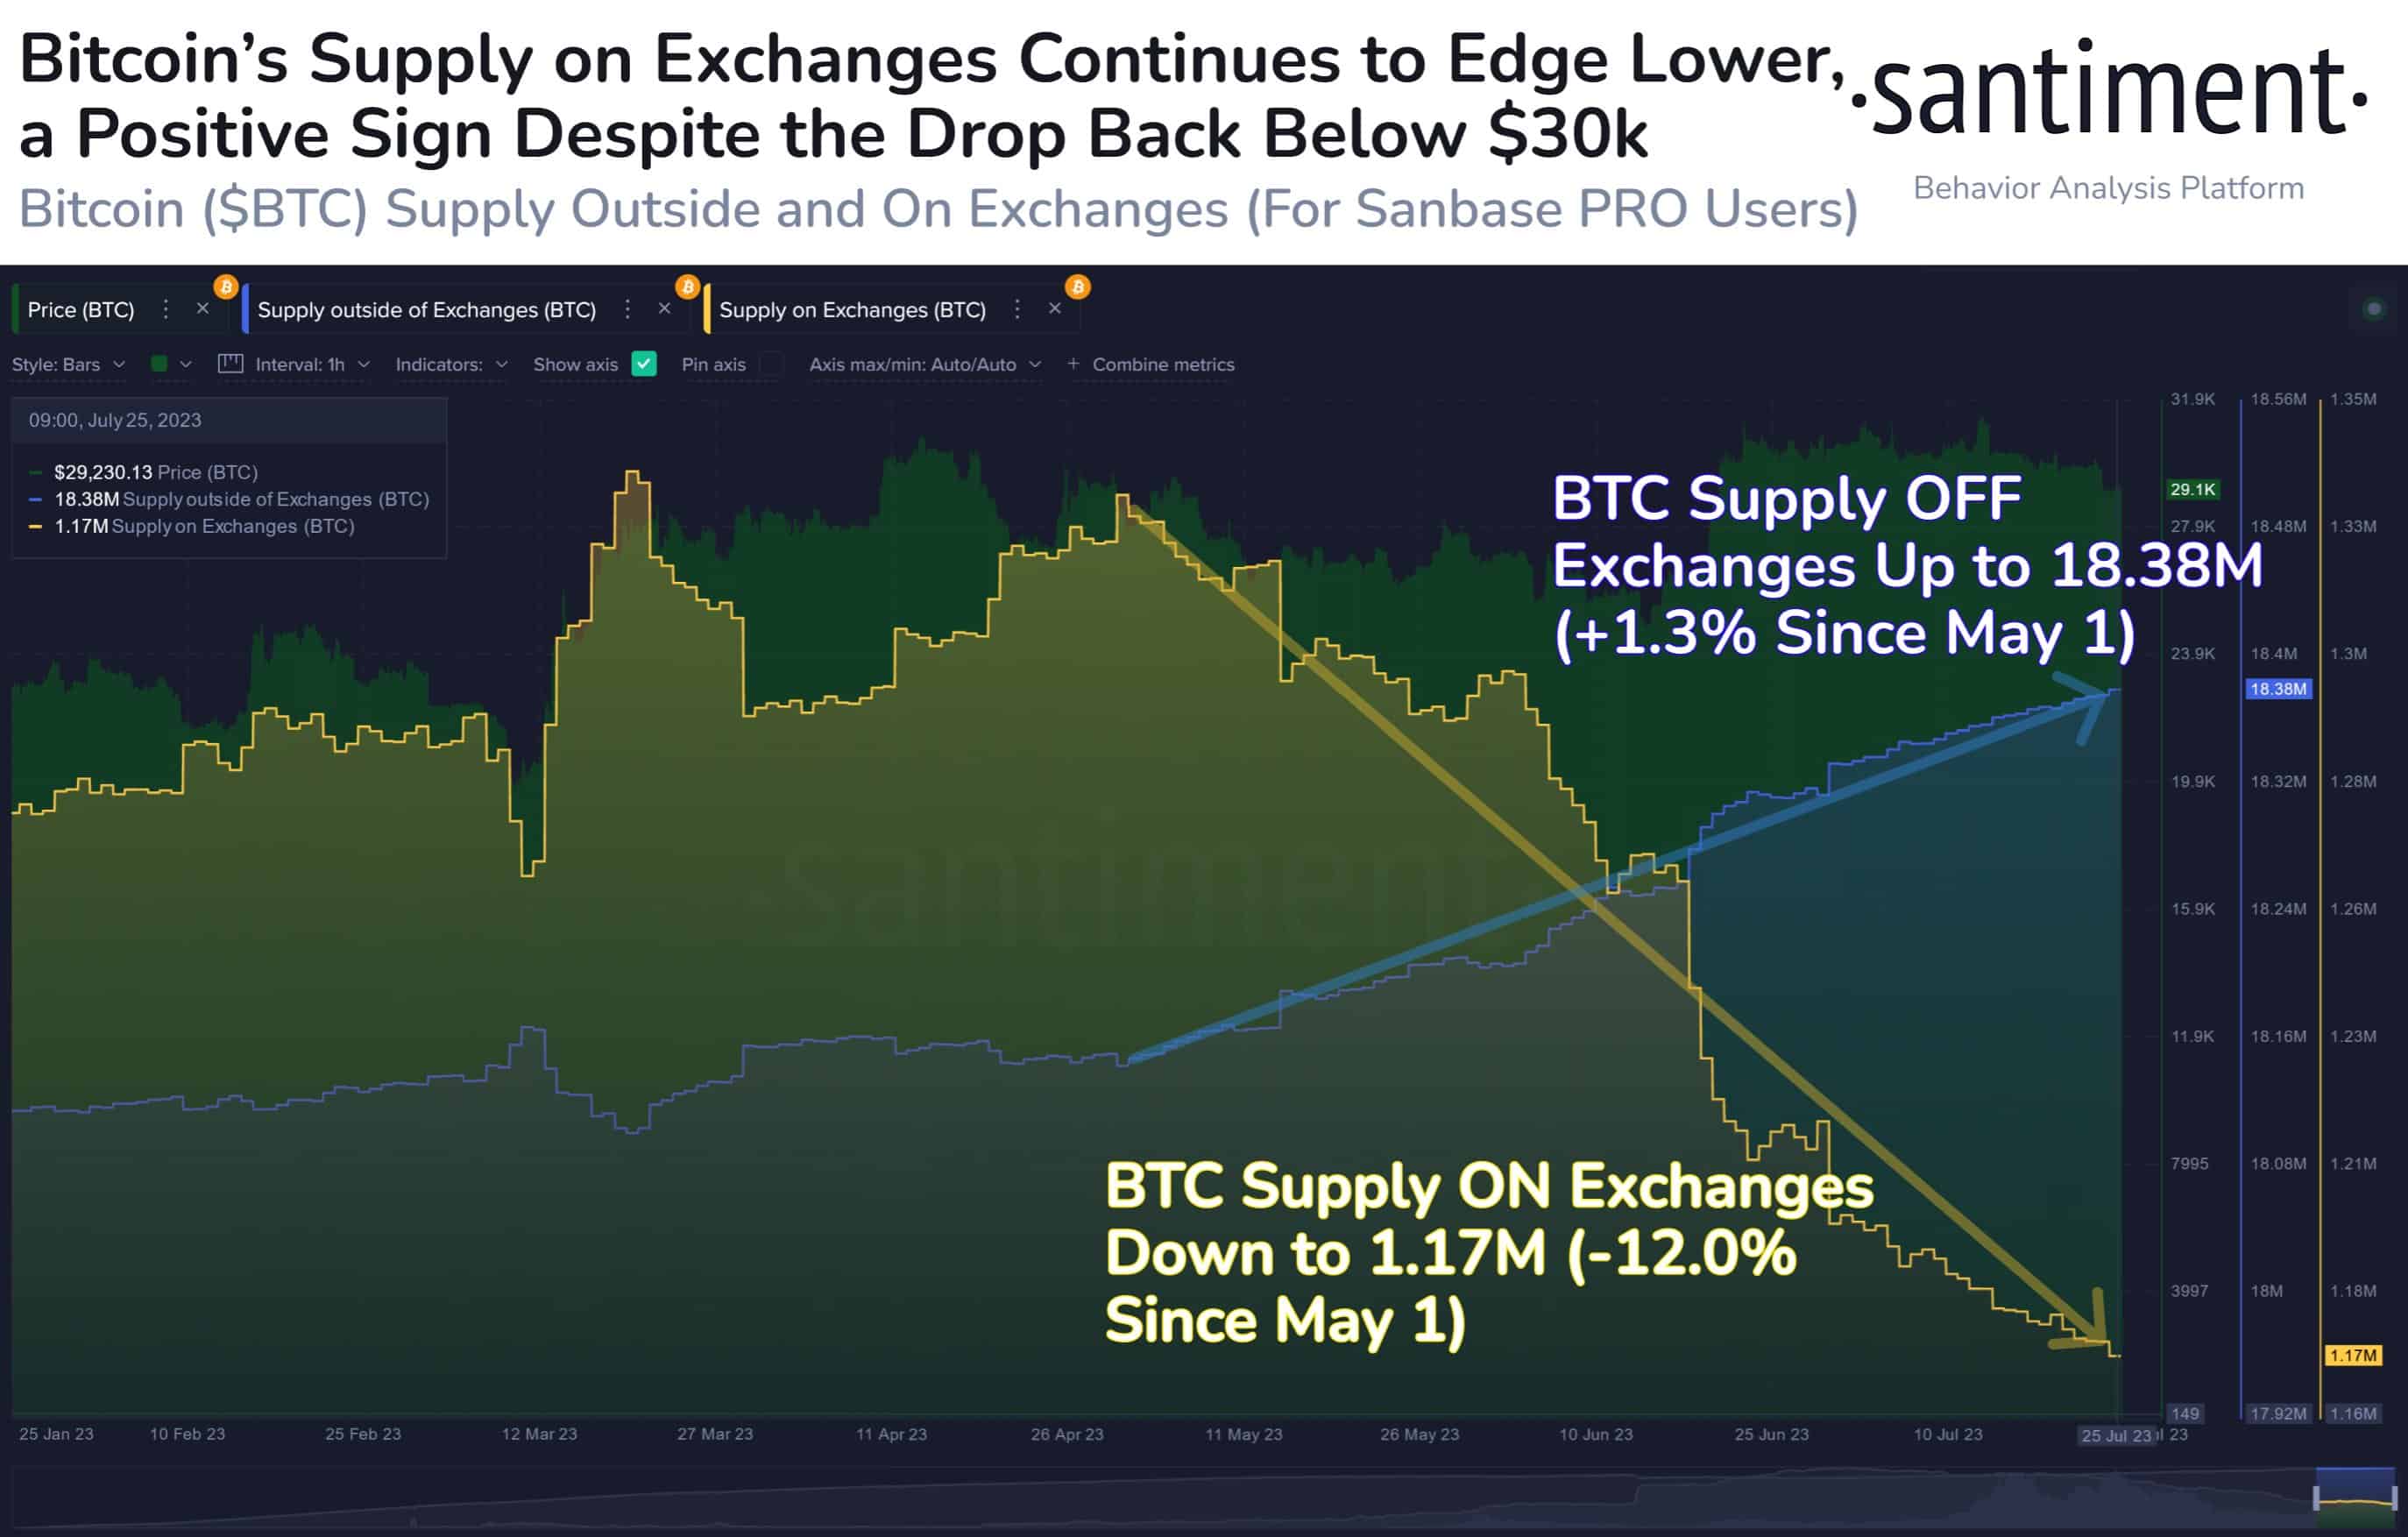
Despite this weakness in the BTC price, some on-chain indicators point out the bullishness going ahead. Even with the Bitcoin price dropping under $30,000, more and more Bitcoins are moving off the exchange and into self-custody. The BTC supply at exchanges has currently dropped to a 5-year low. On-chain data provider Santiment explains:
Bitcoin’s supply on exchanges continues to move into self custody, and the drop below $30k last week hasn’t triggered severe reactions that would indicate #FUD or more upcoming sell-offs. The 1.17M $BTC on exchanges is the least amount since Nov, 2018.

Santiment further explains that despite Bitcoin’s recent drop to $29.2k at the beginning of the week, it is still trading within the familiar price range of $28.0k to $31.8k. This range has been surprisingly narrow for an asset that typically experienced much more significant fluctuations between 2020 and 2022.
Currently, there seems to be more optimism in the market, with more bullish calls than bearish ones. This lack of worry among traders, even after Bitcoin failed to sustainably stay above the important $30k psychological support level, might not be the most positive signal for a potential turnaround.
Bitcoin’s Expanding On-chain Activity
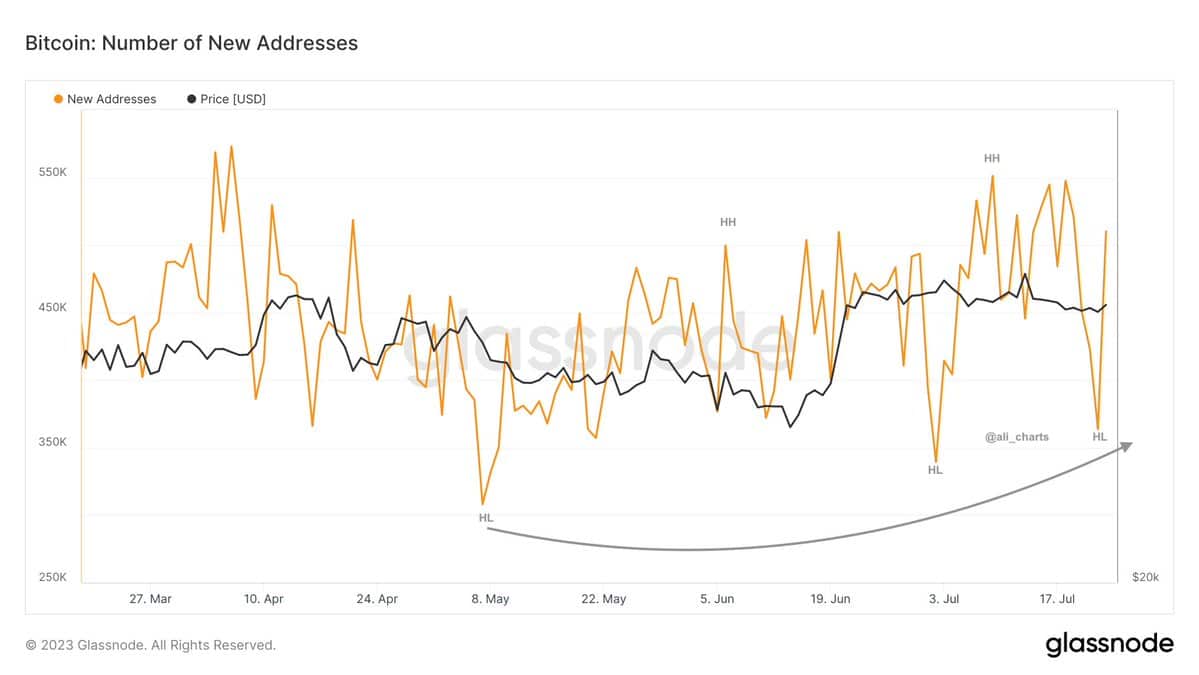
Citing data from Glassnode, popular crypto analyst Ali Charts explains that the number of daily new addresses on the Bitcoin network is growing once again and trending up. this uptick in network utilization gives bullish signals.

When the monthly average of new wallets (shown in green) surpasses the yearly average (shown in grey), it indicates an increase in on-chain activity, signaling a healthier network and growing usage. Following a brief decline, the on-chain activity of Bitcoin ($BTC) is once again expanding!
 Earn Coin
 Mining
 Play Games


 Spin Wheel
 Miner
Miner Play & Win