The last day of the week is more bearish than bullish for the cryptocurrency market, according to CoinMarketCap's ranking.
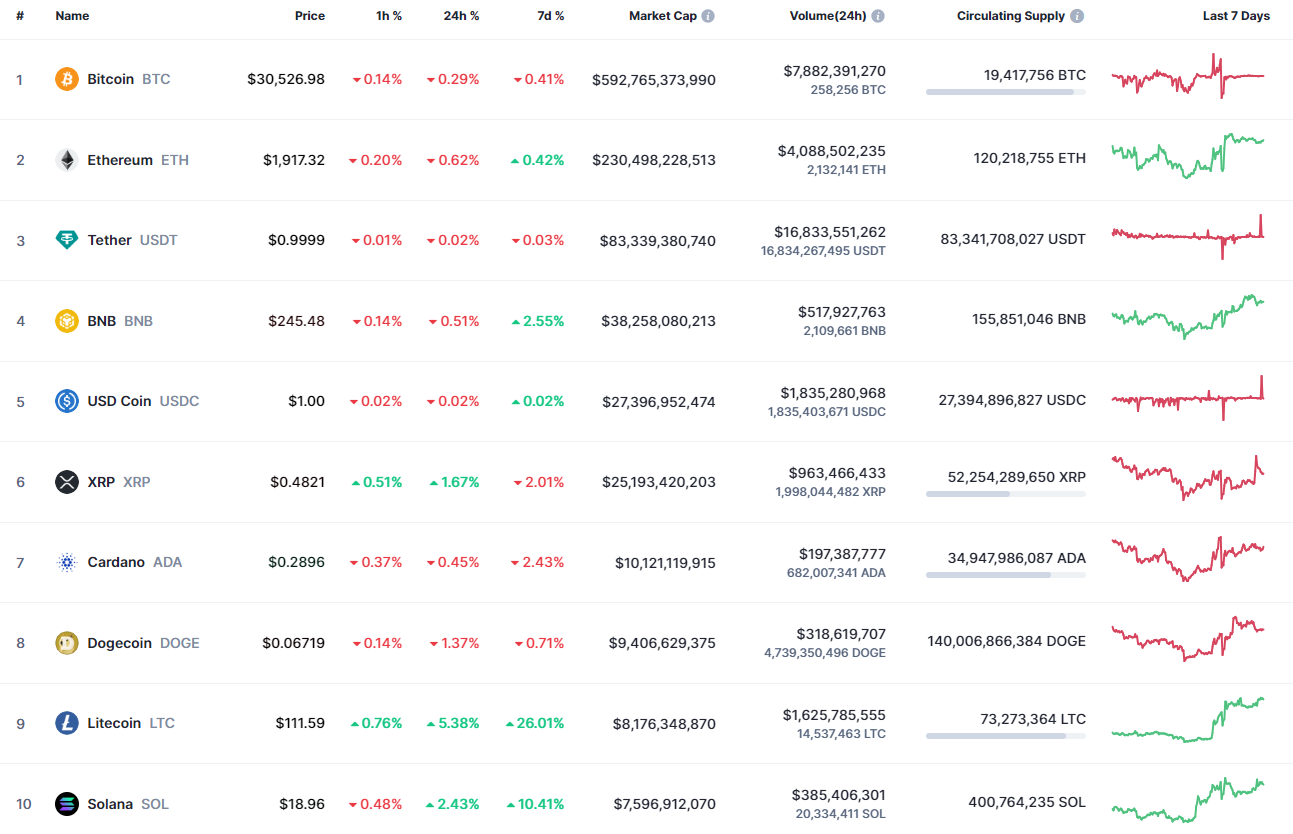
Top coins by CoinMarketCap
BTC/USD
The rate of Bitcoin (BTC) has fallen by 0.29% since yesterday. Over the last week, the price has fallen by 0.41%.
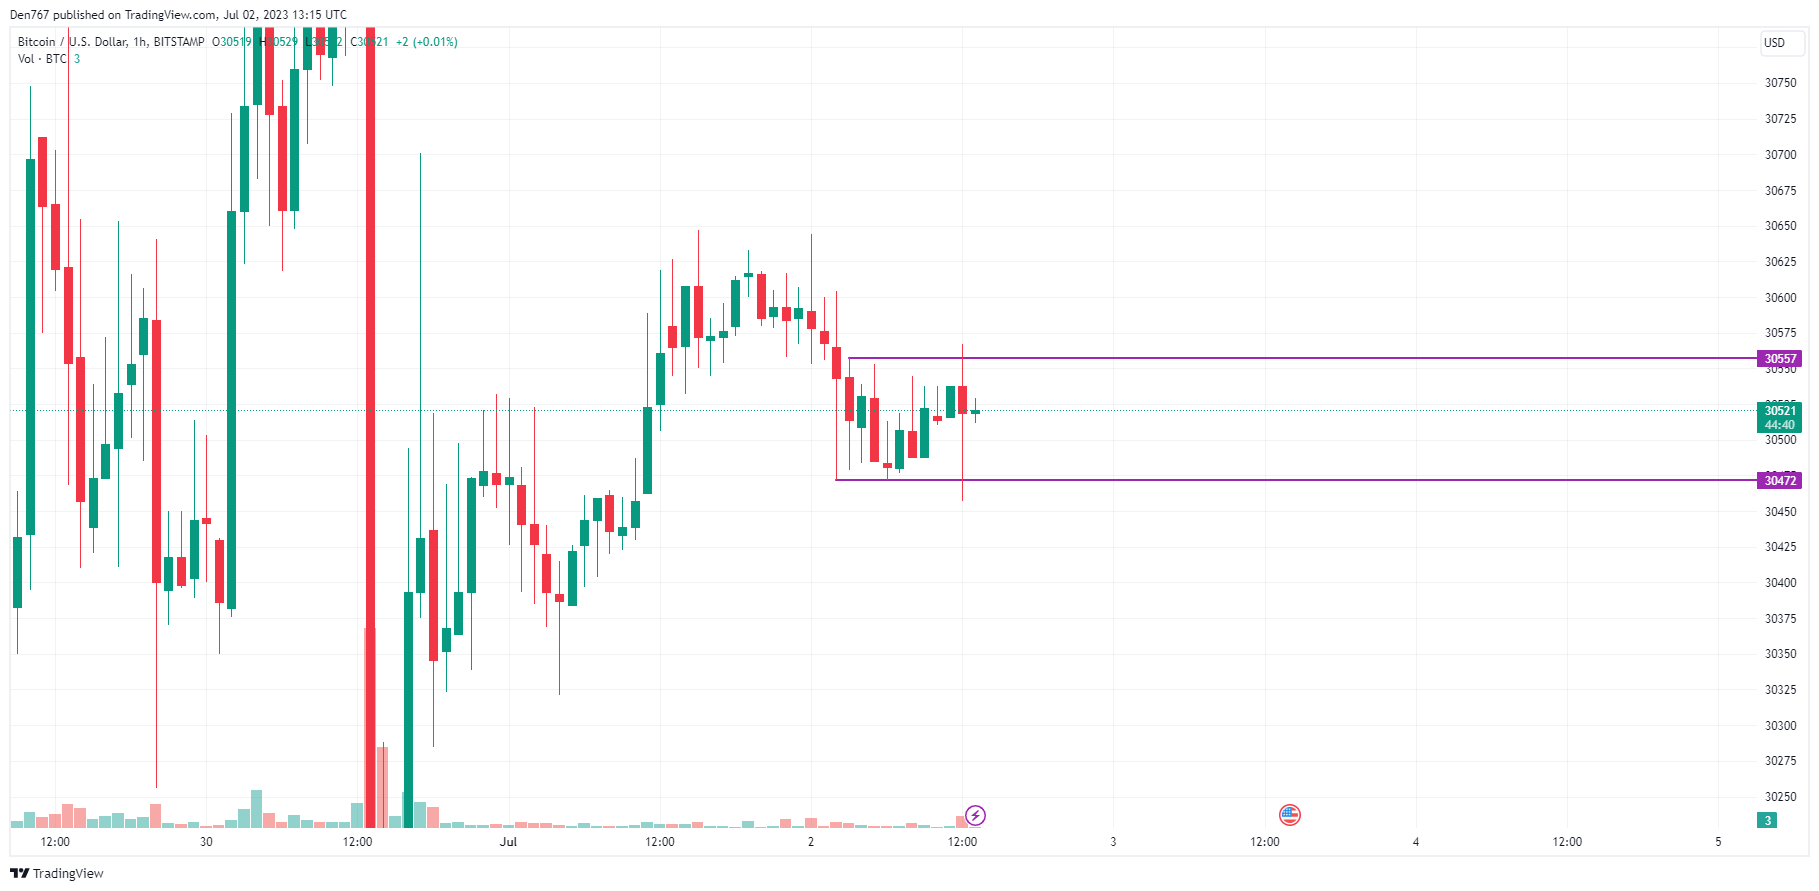
Image by TradingView
On the hourly chart, the rate of Bitcoin (BTC) is in the middle of the narrow range between the support at $30,472 and the resistance at $30,557. Any sharp moves are unlikely until the end of the day as most of the daily ATR has been passed.
In this case, ongoing consolidation in the area of $30,500 is the more likely scenario.
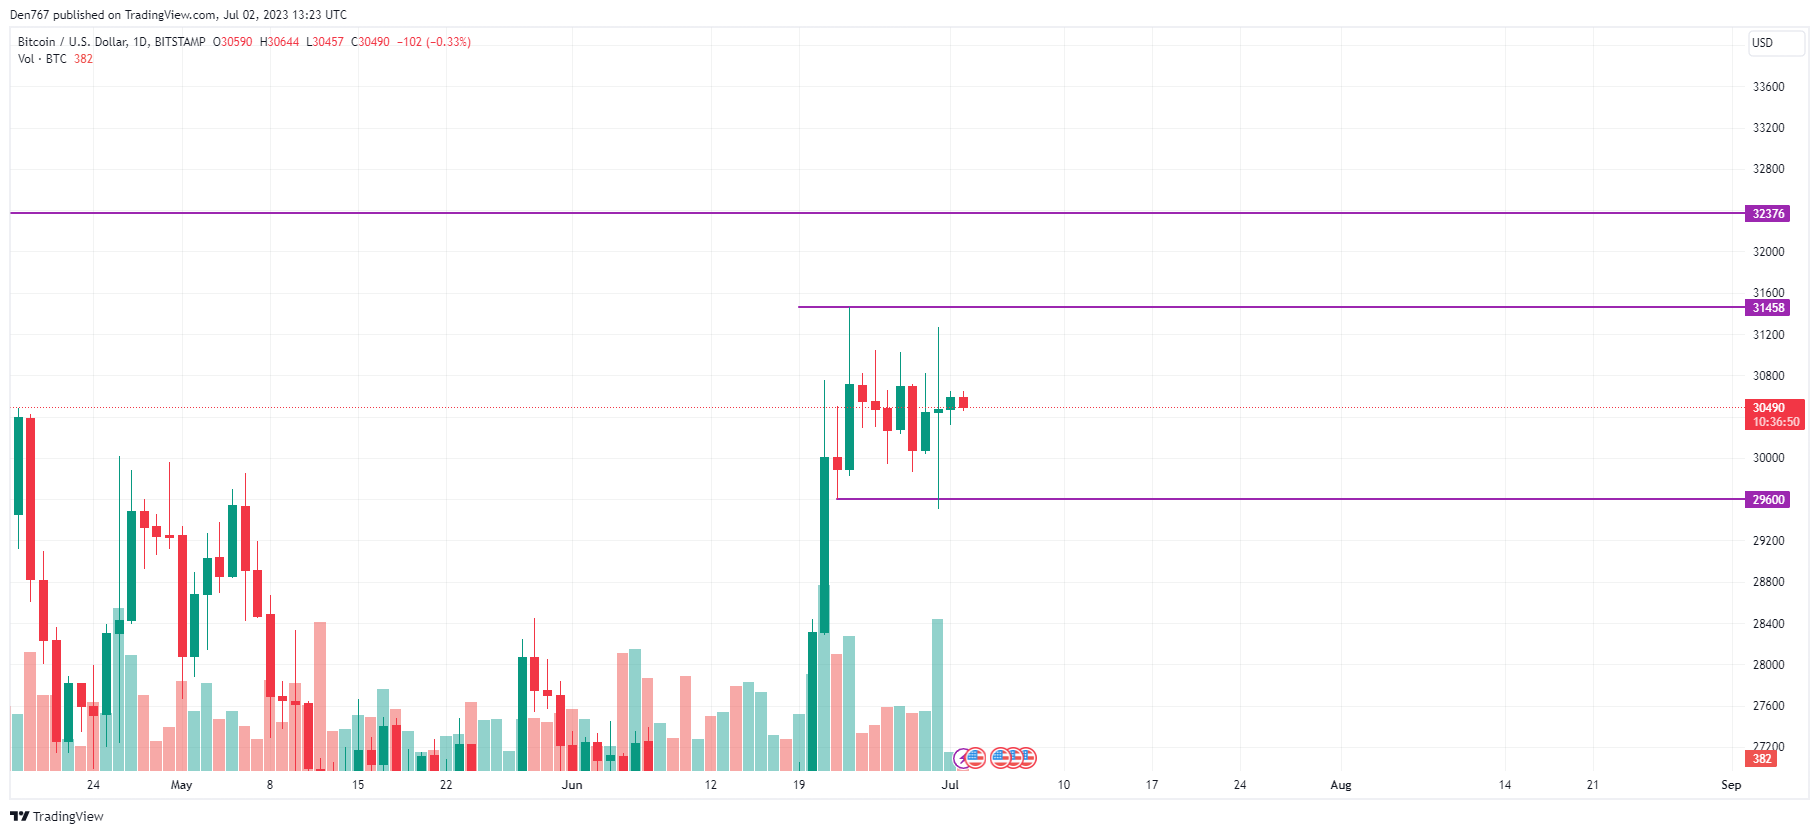
Image by TradingView
On the bigger time frame, the situation is similar as neither bulls nor bears have seized the initiative. If buyers want to seize the initiative, they need to restore the rate to the $31,200 zone. In this case, there is a high possibility to see a breakout of the resistance at $31,458.
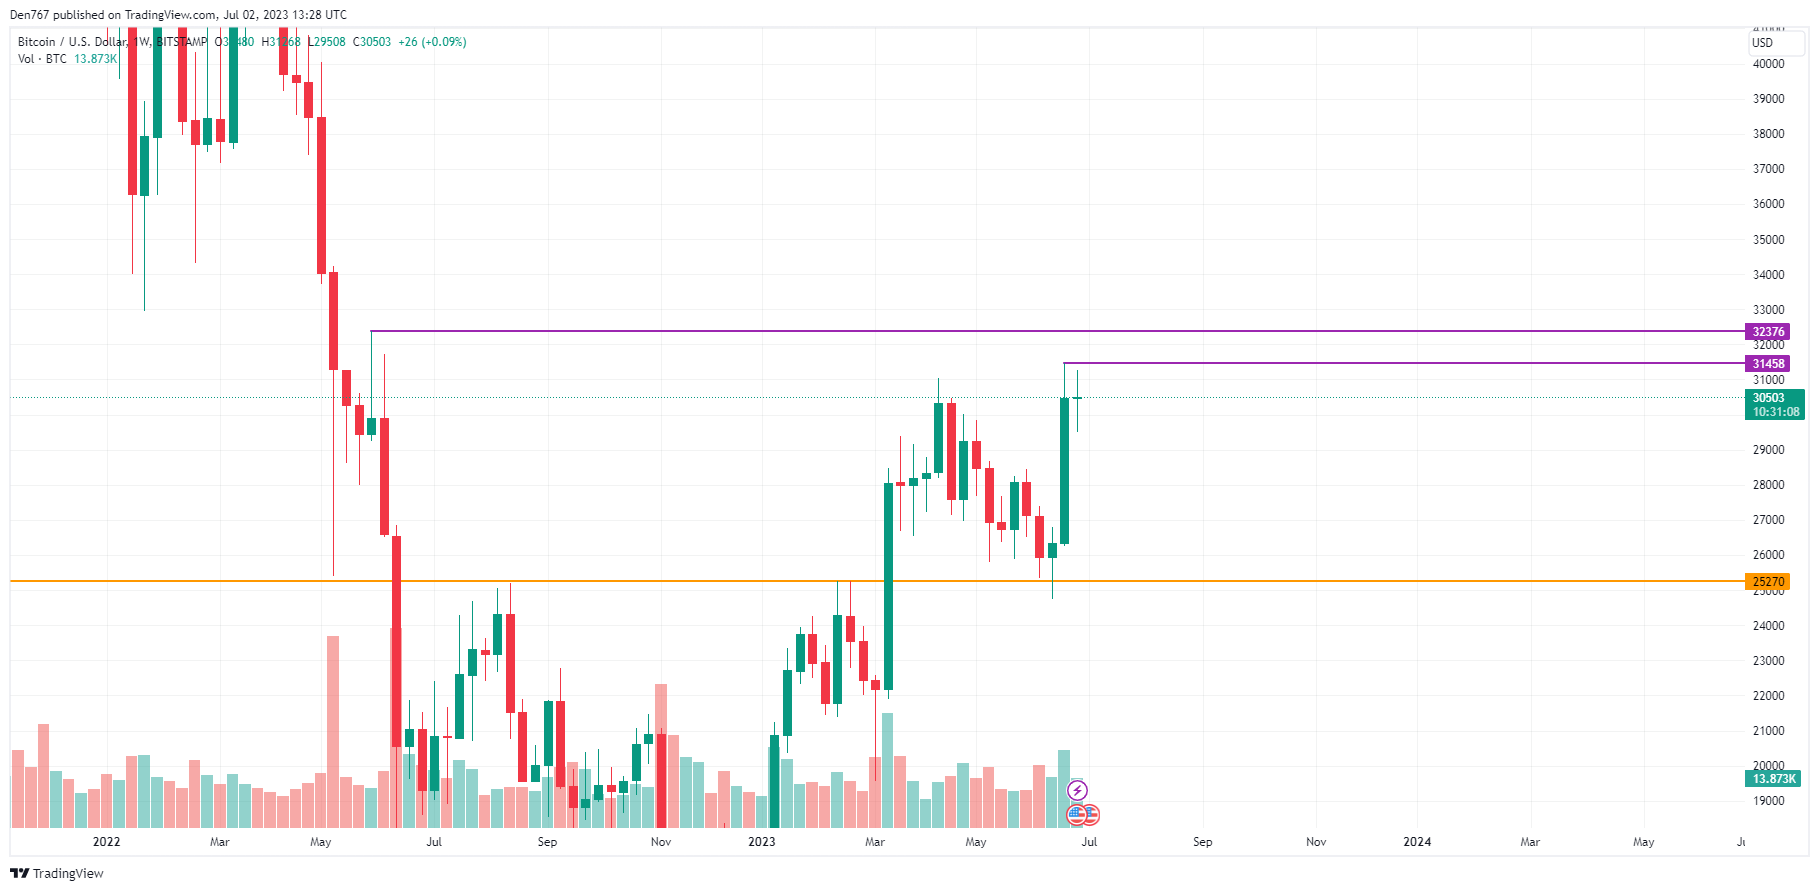
Image by TradingView
From the midterm point of view, traders should pay attention to the recent candle peak at $31,458. If the bar closes above it with no long wick, the rise may continue and lead to a test of the next resistance level at $32,376.
Bitcoin is trading at $30,502 at press time.
 Earn Coin
 Mining
 Play Games


 Spin Wheel
 Miner
Miner Play & Win