Bitcoin Price Prediction: Trailing smoothly over the past few weeks of high bullish momentum, a hiccup arises in the bitcoin Price trend. With a few Bitcoin Spot ETF approvals being delayed, the market sentiments take a short dip warning of a pullback. The coin Price sustains above the $35K mark but the increased volatility warns of a quick correction if things go south with the Bitcoin Spot ETFs.
Also Read: Bitcoin Price Rally Is Powered By Shrimp Wallets: Report
Will Market Uncertainty Push BTC to $35000?
- A channel pattern carrying the current distribution phase is in BTC
- A bearish breakdown from the support trendline would set a pullback to the $32000 mark
- The intraday trading volume in Bitcoin is $13.1 Billion, indicating a 3.1% loss.
 Source-Tradingview
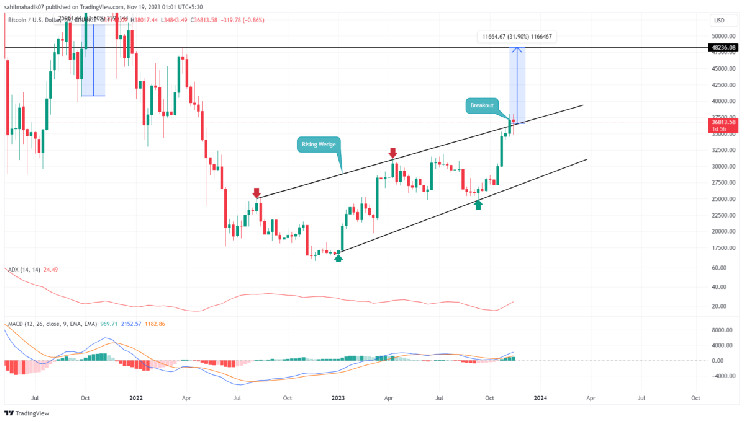
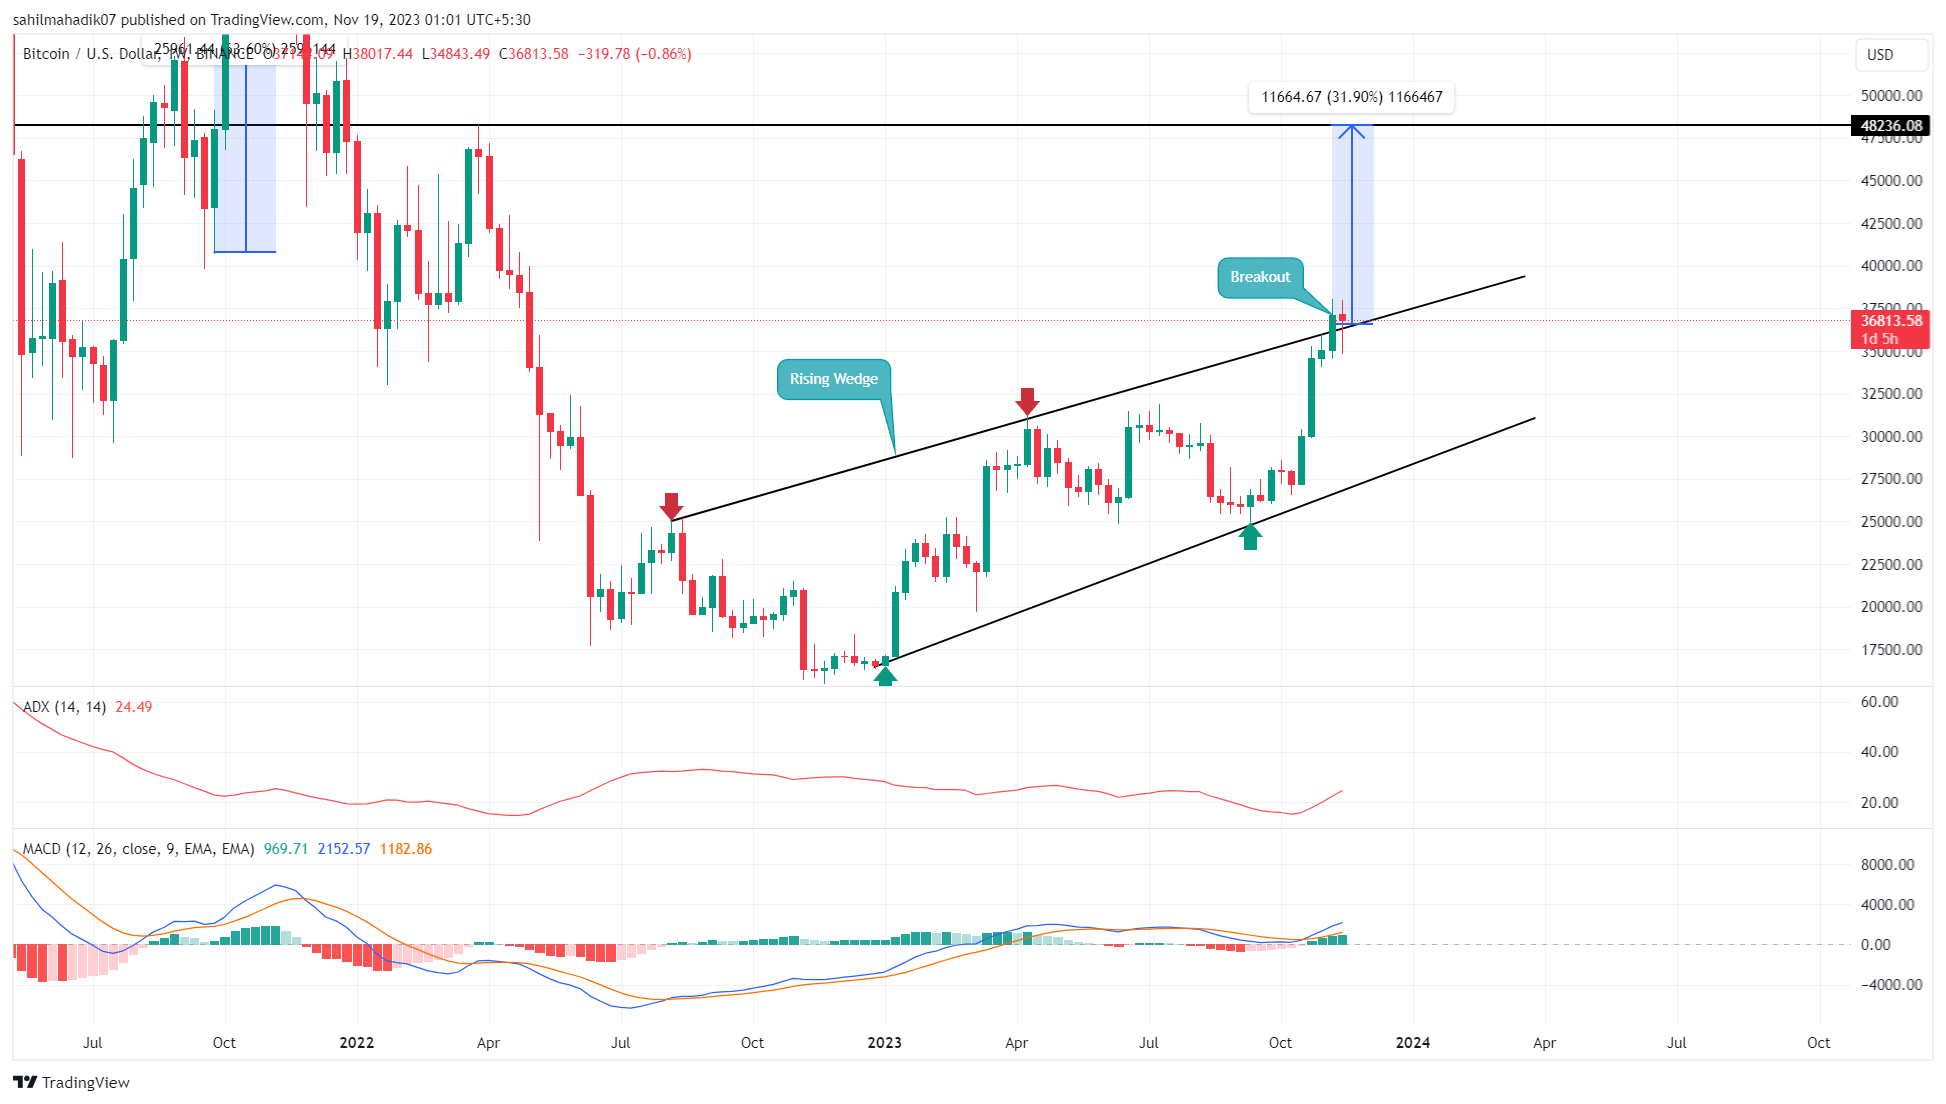
Keeping a bullish trend in the weekly chart, the Bitcoin price makes a rising channel pattern. The remarkable recovery with the high anticipation of a Bitcoin Spot ETF arrival drives the BTC price beyond the $35K mark.
Further, the high momentum positive cycle in the channel surpasses the overhead resistance and teases a new breakout rally. However, a pullback phase highlights the increased supply over the channel.
Currently, the weekly candle shows a bearish influence but with a long tail representing demand at lower levels.
A potential breakout above this pattern will unleash the trapped momentum and prolong the uptrend. The beauty rally will likely surpass the $40,000 mark, followed by a jump to $48,000, registering a potential hike of 30%.
However, a retracement within this channel can lead to a sharp correction, resulting in the BTC price falling to $35,000.
Will Recovery Surpass $40000?
With the upcoming deadlines of multiple Bitcoin Spot ETF applications, the market sentiment remains bullish and anticipates a breakout trend. Moreover, the anticipation is highest around Blackrock’s Bitcoin Spot ETF and can drive the Bitcoin price before approval on the deadline.
This potential sentiment-based rally may intensify the recovery to cross the $42,000 to challenge the $45,000 mark.
-
Moving Average Convergence Divergence (MACD): The MACD and the signal line in a bullish crossover state indicate that the asset is in a bullish trend.
-
Average Directional Index (ADI): The ADX, with a current reading of 24%, suggests the buyers hold enough momentum to prolong the recovery trend.
 Earn Coin
 Mining
 Play Games


 Spin Wheel
 Miner
Miner Play & Win