The Verge (XVG) price has increased by nearly 600% since June 15. The increase accelerated on July 3, leading to a new yearly high.
The XVG price currently trades at a crucial short- and long-term horizontal resistance level. Whether it breaks out from it or gets rejected will be critical in determining the future trend.
Did Verge Begin a Bullish Trend Reversal?
The weekly time frame technical analysis for XRP provides a bullish outlook for numerous reasons.
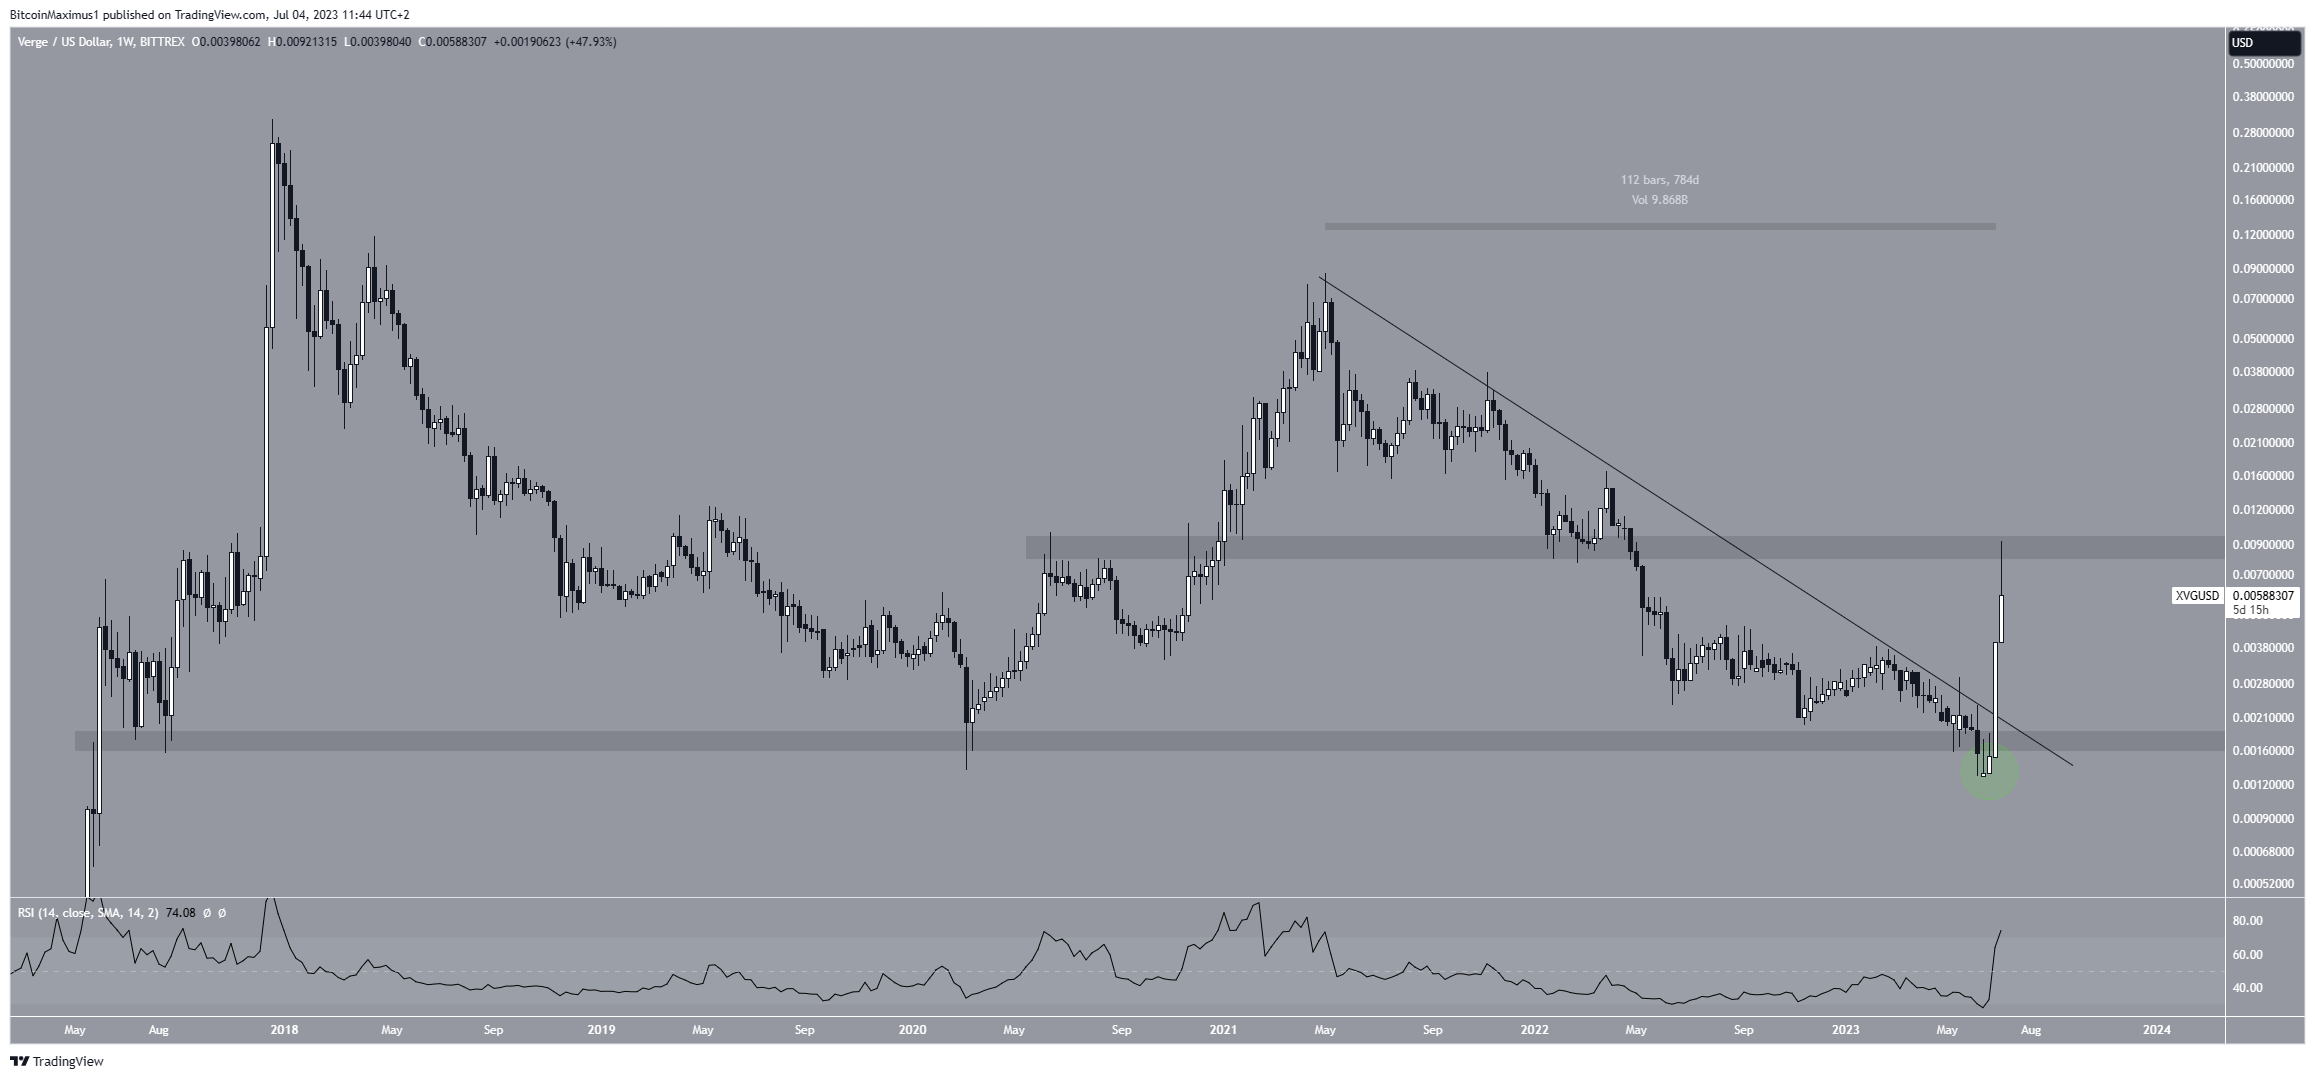
The XVG price seemingly broke down from the $0.0018 horizontal area at the beginning of June. This is a crucial area since it had previously provided support since May 2017.
Read More: Best Crypto Sign-Up Bonuses in 2023
So, the breakdown from it was considered a decisively bearish development that could lead to a sharp sell-off.
However, the breakout turned out to be illegitimate since the XVG price immediately reversed (green circle), creating successive bullish weekly candlesticks.
At the beginning of July, the XVG price broke out from a descending resistance line that had been in place for 784 days. When combined with the deviation and reclaim, this confirmed that the XVG price had begun a bullish trend reversal.

The weekly RSI also supports the continuing increase. The RSI is a momentum indicator used by traders to evaluate whether a market is overbought or oversold and to determine whether to accumulate or sell an asset.
Readings above 50 and an upward trend suggest that bulls still have an advantage, while readings below 50 indicate the opposite. The RSI is above 50 and moving upwards, indicating that the trend is bullish and the increase will continue.
Read More: Best Upcoming Airdrops in 2023
What’s Behind The XVG Price Increase?
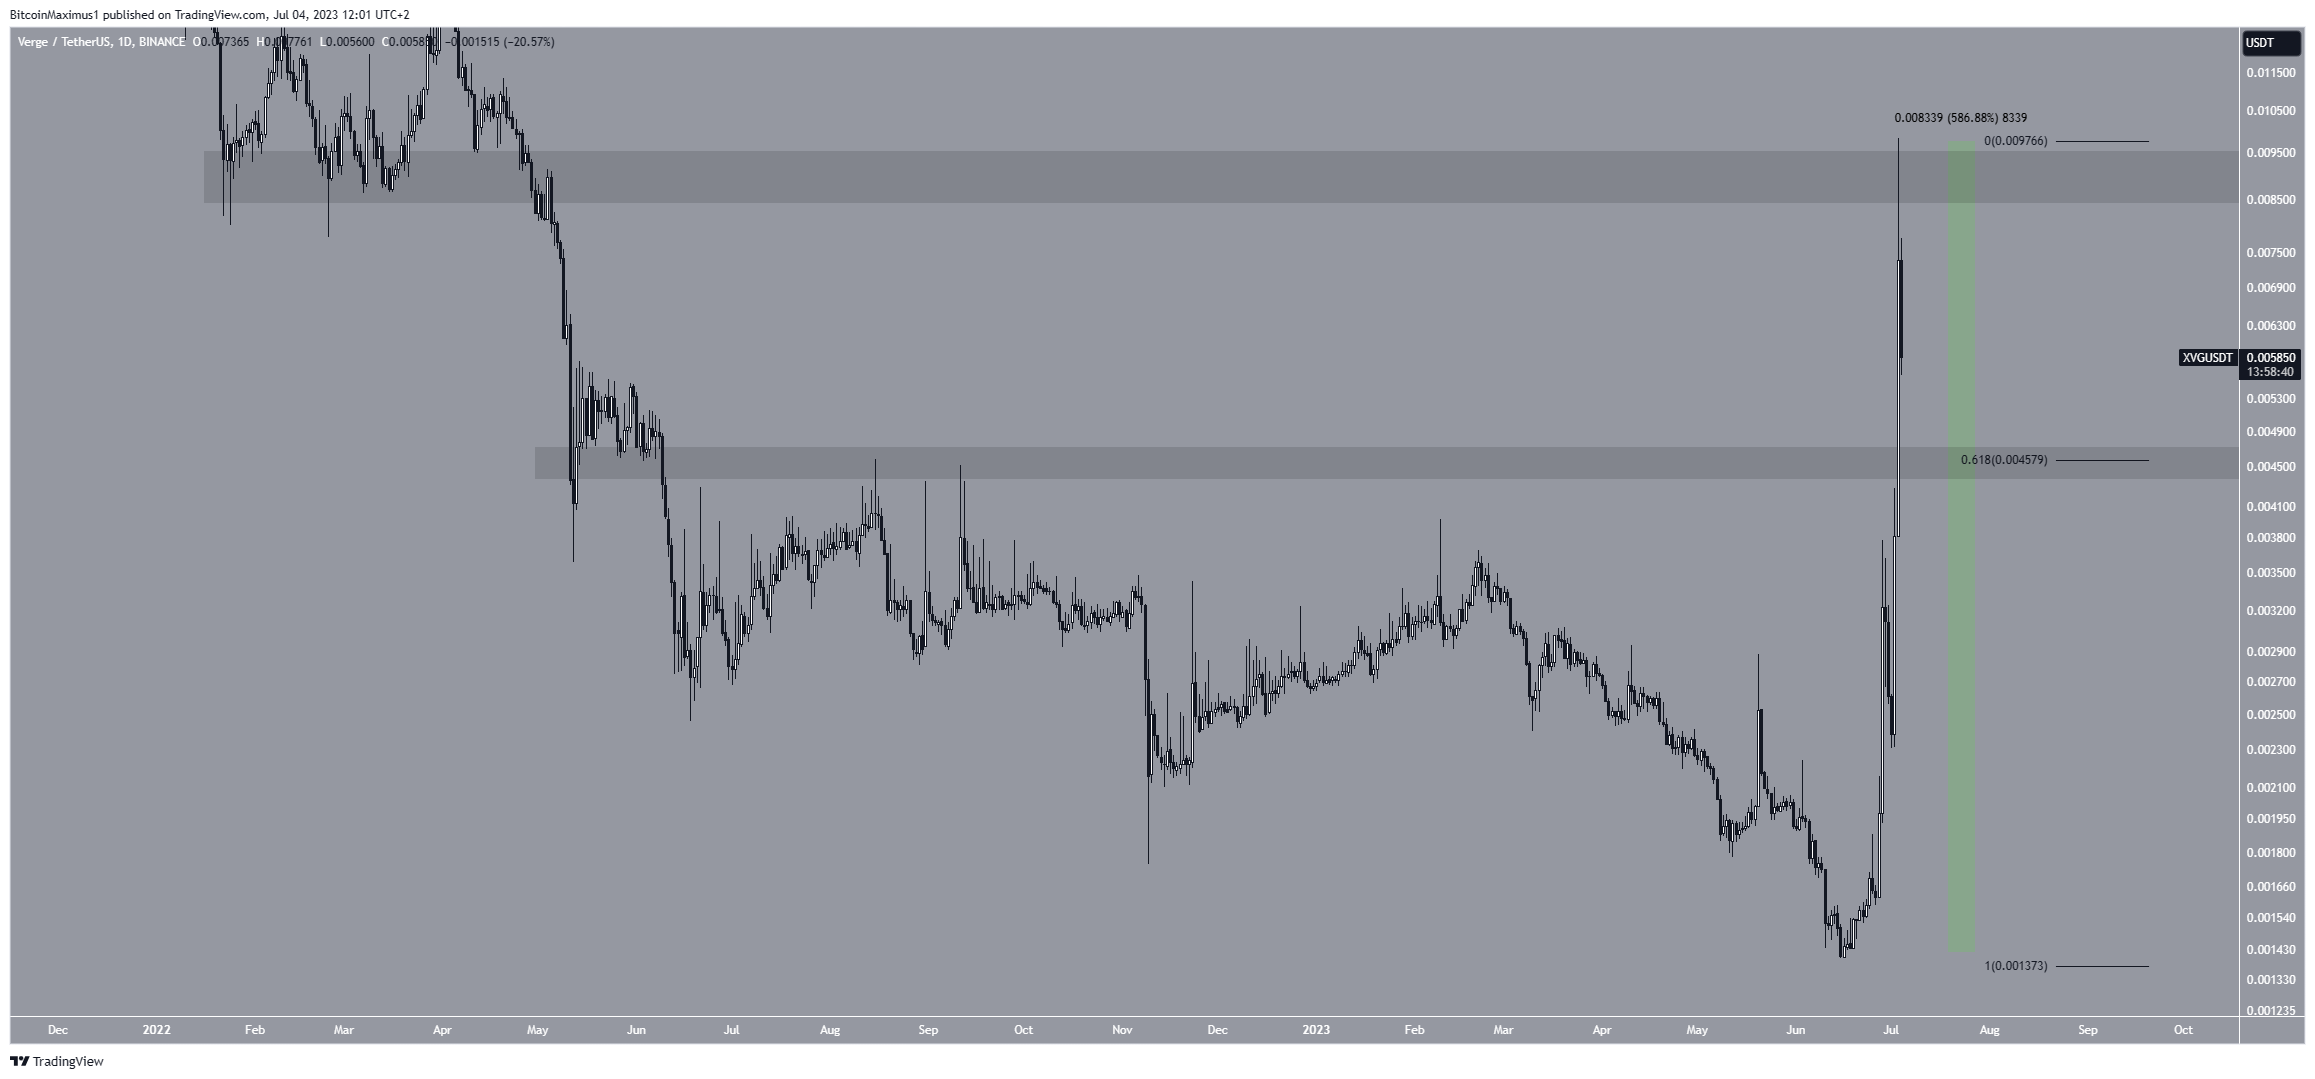
The daily time frame shows that the XVG price has increased by nearly 600% since its yearly low on June 16. It paced the entire cryptocurrency market during this time. The increase especially accelerated on July 3.
Over the past 24 hours, the XVG market cap has more than tripled, taking the coin to the top 250 based on its market capitalization.
This massive increase also led to a significant increase in trading volume. The 24-hour trading volume for XVG is at $450 million. This puts it in the top 10 coins overall in trading volume, ranking in the top seven if stablecoins are removed. This is quite unusual for a coin that is ranked #249 by its market capitalization at the time of writing.
The XVG price now trades at the $0.0090 resistance area. This is both a short- and a long-term resistance, increasing its significance. Therefore, if the XVG price breaks out from it, it can increase nearly tenfold to $0.0900.
However, the Verge price was rejected on its first breakout attempt, creating a long upper wick (red icon). XVG could fall to the 0.618 Fib retracement support level if the rejection continues at $0.0046.

To conclude, whether the XVG price breaks out above the $0.0090 area or gets rejected can determine the future trend. A significant rally to $0.0900 could transpire in case of a breakout.
However, if the XVG price gets rejected, a short-term retracement to $0.0046 could be on the cards.
 Earn Coin
 Mining
 Play Games


 Spin Wheel
 Miner
Miner Play & Win