While Ripple’s XRP price failed to clear a crucial horizontal resistance area and fell afterward, it is currently attempting to find short-term support.
Despite the failure to break out, XRP’s price created a bullish pattern and potentially began a short-term reversal. The reaction and the $0.52 area will be crucial to determine the future trend.
Ripple Price Resumes Descent After Rejection
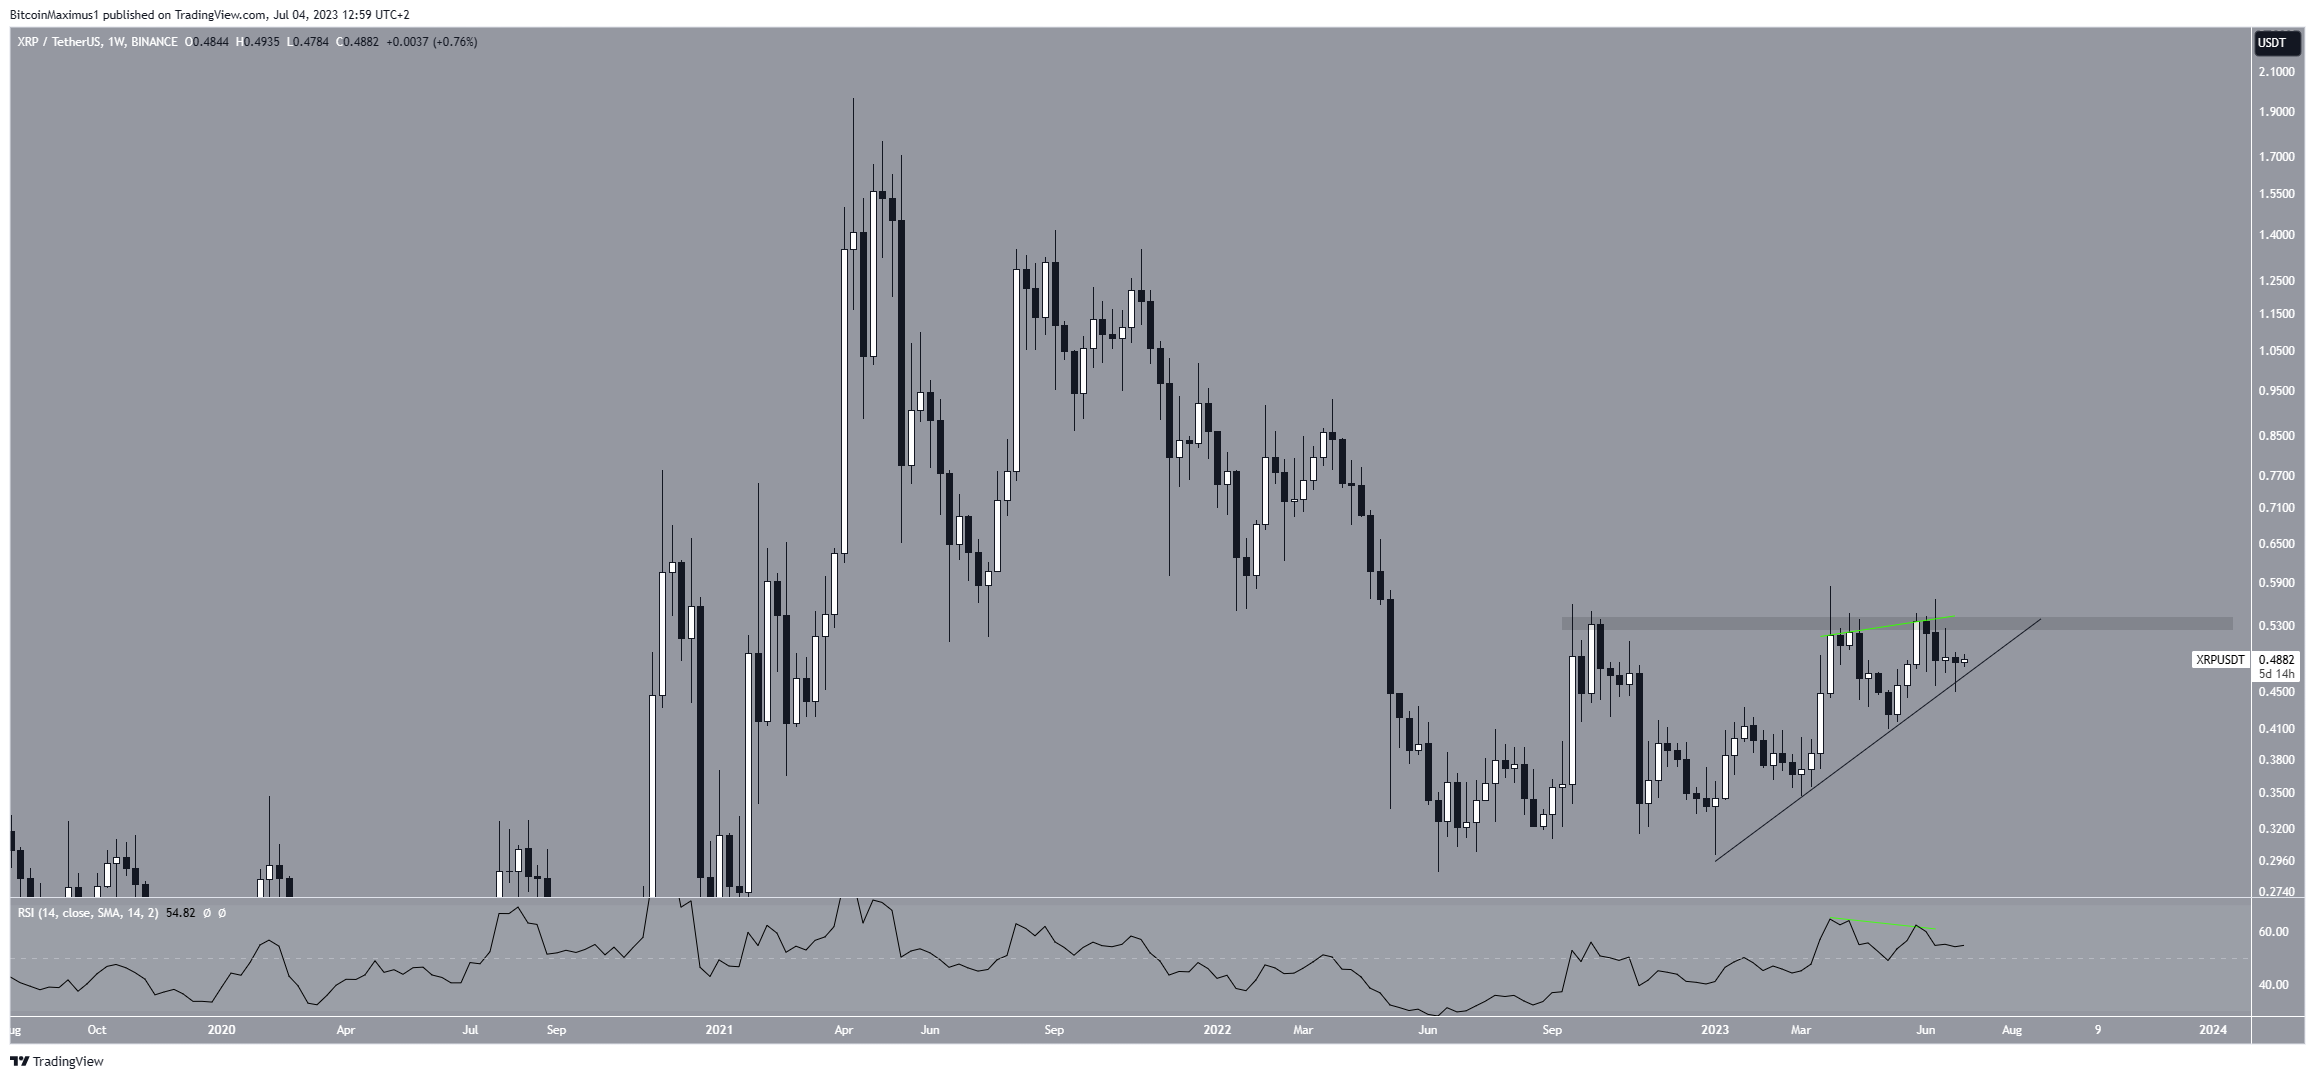
The XRP price has made three failed attempts at moving above the long-term resistance of $0.53 since September 2022 since the area had been in place for nearly a year; whether the price moves above or below it could determine the future trend.
Therefore, a breakout above it would be expected to accelerate the rate of increase, while a rejection could cause a sharp drop.
Next, the XRP price may have followed an ascending support line since the beginning of the year. When combined with the $0.53 area, this creates an ascending triangle, considered a bullish pattern.
This means that an eventual breakout from it will be the most likely scenario.

However, the Relative Strength Index (RSI) outlines a possibility for a downward trend. Traders rely on the RSI as a momentum gauge to determine if a market is excessively bought or sold, helping them decide whether to accumulate or sell an asset.
Bulls have the upper hand when the RSI reading surpasses 50, and the trend is upward. Conversely, an RSI drop below 50 reverses the situation. Despite the RSI being above 50, it is showing a decline, suggesting weakness.
Furthermore, there is a bearish divergence in the RSI. This is an occurrence in which a momentum decrease accompanies a price increase. It is often a precursor to downward movements.
Read More: Best Crypto Sign-Up Bonuses in 2023
XRP Price Prediction: Triple Bottom Can Lead to Bullish Momentum
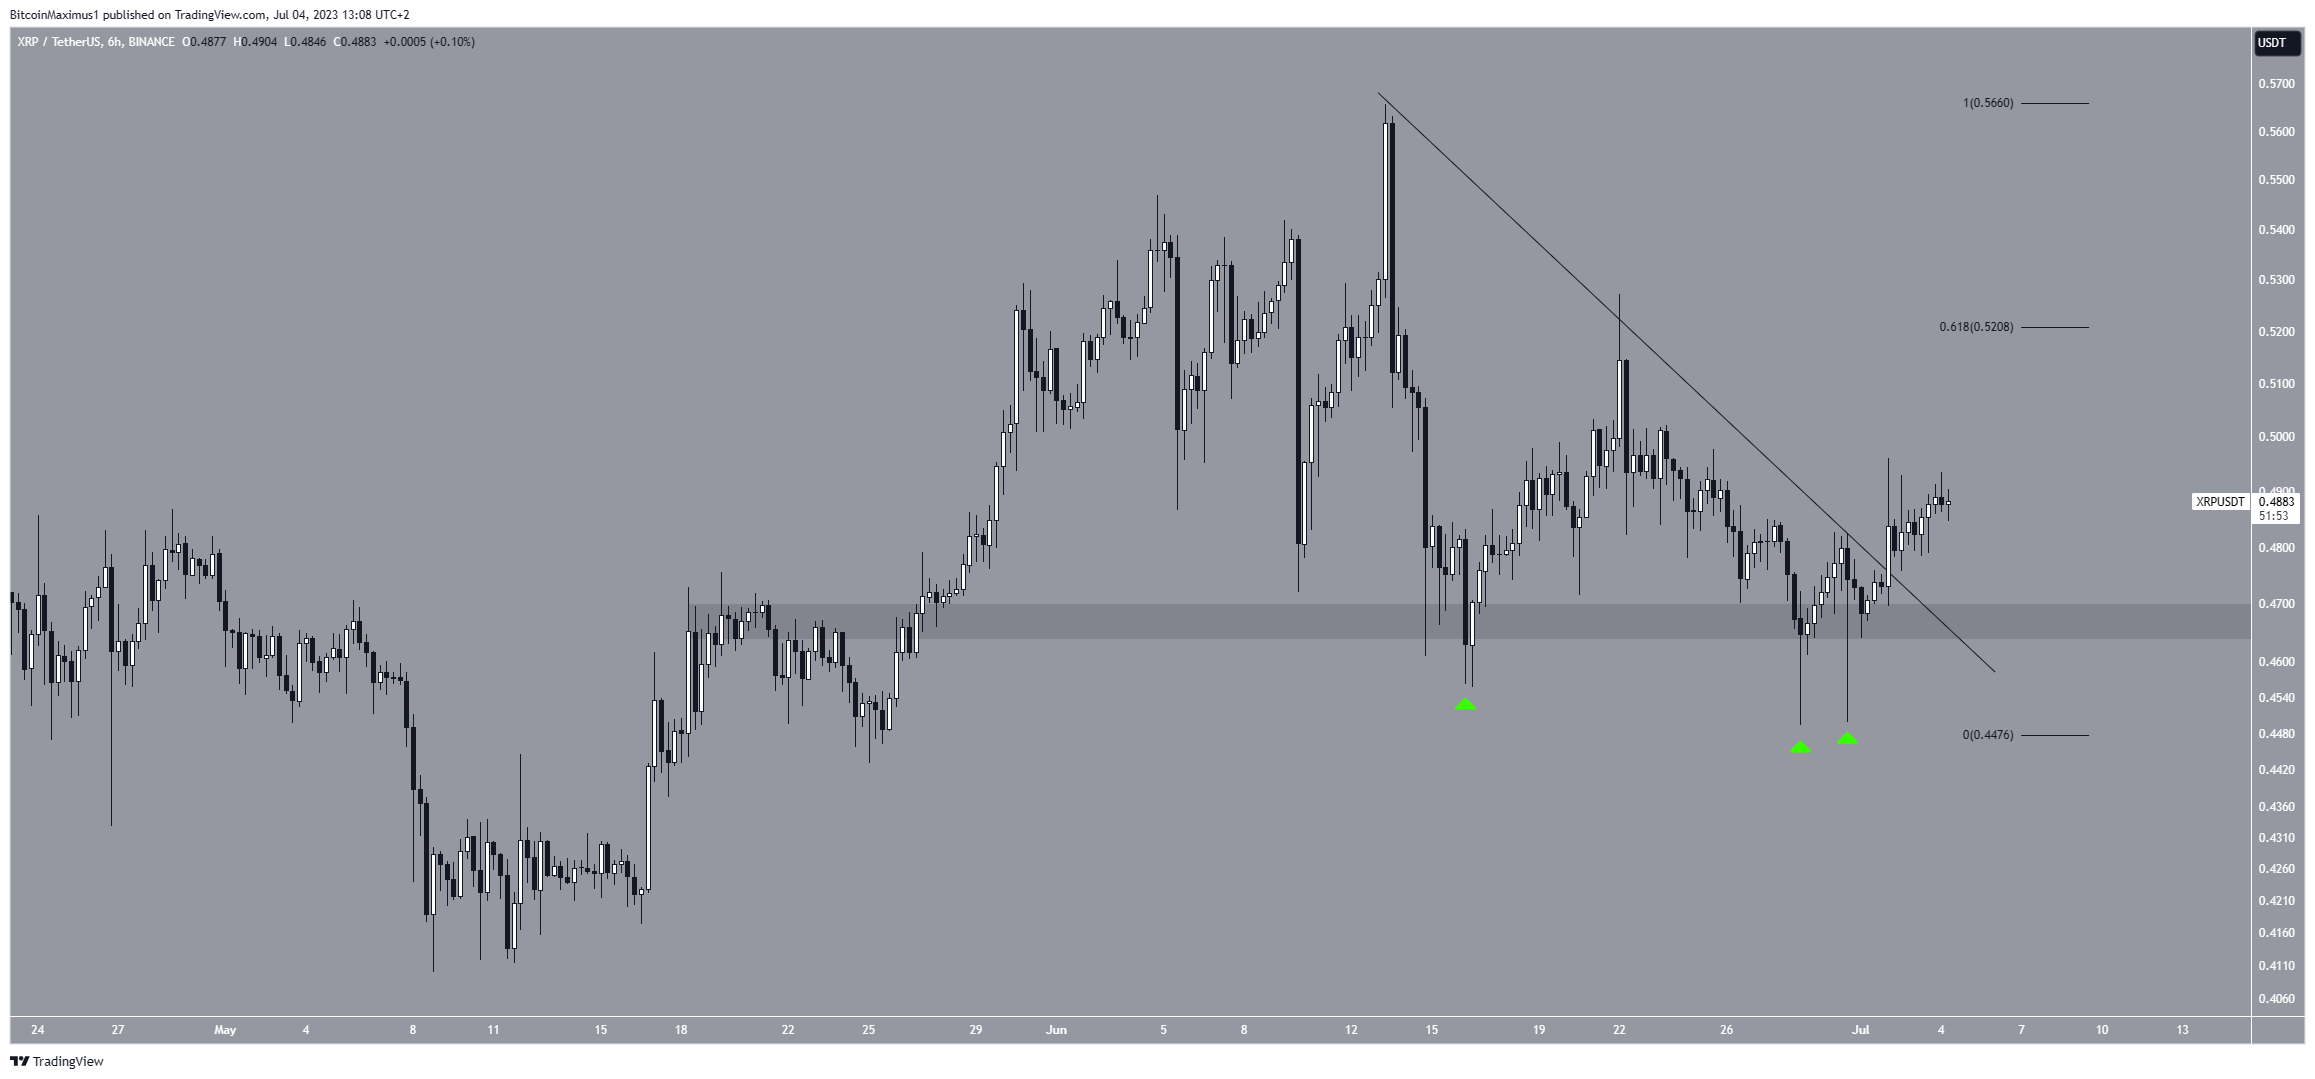
According to technical analysis of the short-term six-hour time frame, the price of XRP will increase in the short term.
This bullish prediction is based on the price action and creating a short-term triple bottom, which is considered a bullish pattern. The triple bottom is also characterized by long lower wicks (green icon) and occurs inside a horizontal support area. Thus, it is likely that it leads to a bullish trend reversal.
After the final bounce, the XRP price broke out from a descending resistance line. This confirmed that the short-term trend is bullish, and an increase will follow. It is possible that the now-debunked news that Gary Gensler had resigned as the head of the SEC aided the increase.
The closest resistance area is at $0.52, created by the 0.618 Fib retracement resistance level. This is in close proximity to the previously outlined long-term $0.53 resistance area. Therefore, a breakout from one will likely cause a breakout from the other.

Therefore, the future XRP price prediction will be determined by whether XRP breaks out above $0.52 or gets rejected. In case of a breakout, the price can quickly rally to $0.65 and beyond.
However, a rejection would likely also cause a breakdown from an ascending support line and drop to $0.40.
 Earn Coin
 Mining
 Play Games


 Spin Wheel
 Miner
Miner Play & Win